
Please Don't Smooth the Metrics
Smoothing metrics can hide the very problems operators and boards need to see. A worked example shows how a rolling churn rate delays a critical conversation by six months—and why the volatility is the point.

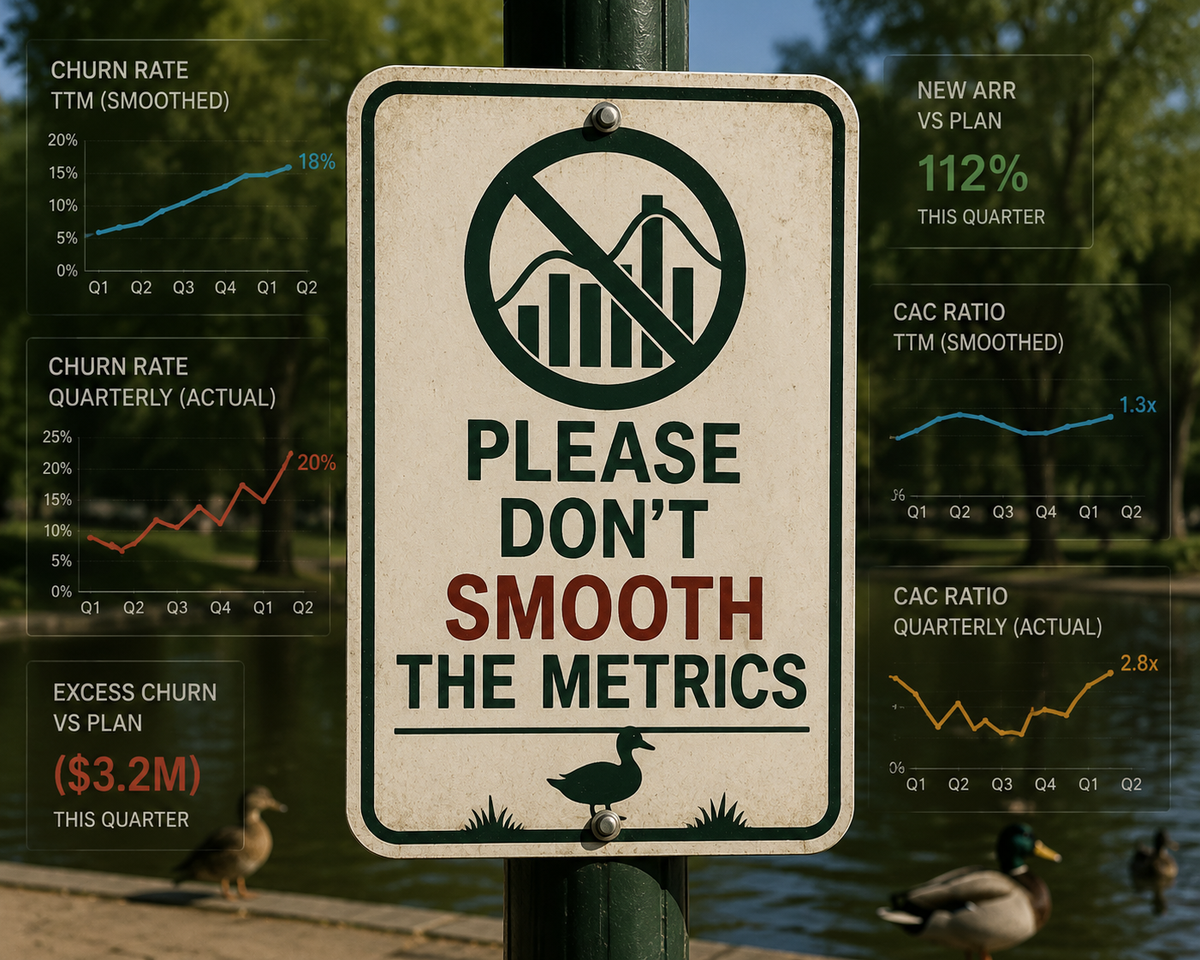
Investors have lots of good habits when it comes to metrics. Operators can copy many of them. One habit they shouldn't copy, however, is smoothing.
Smoothing has a legitimate purpose. Investors are trying to understand businesses. They're looking for long-term trends and patterns, so they want to damp out seasonality and quarter-to-quarter noise.
Suppose 40% of your orders come in Q4. Roughly 40% of your churn is going to occur in Q4 as well. Maybe more than half of it will occur in December. That volatility doesn't really tell you anything interesting. It's just the calendar. Smoothing makes it easier to see the underlying trend. The same argument applies to CAC. If you hire a bunch of salespeople in Q1, those investments won't pay off until Q2, Q3, and Q4. Looking at quarterly CAC can produce wild swings that don't reflect the underlying efficiency of your go-to-market model. A rolling 12-month CAC ratio is often a much better metric.
So, if you're an investor – and you're in investment-mode – then smooth to your heart's content.
But for the love of God, don't be a smooth operator. No, I don't mean the 1980s R&B hit. I mean an operator — someone running a business. As an operator, don't smooth your metrics. Why? Because smoothing hides the very volatility you should be looking for.
Smoothing is a sharp, double-edged sword. The same smoothing that can make a trend more visible can also obscure one. I don't think management teams smooth metrics in bad faith. I think they smooth them out of habit (because investors often ask) and because they're convinced it's the best way to see long-term trends.
But if I wanted a dark-arts technique for deferring an uncomfortable conversation about a deteriorating CAC ratio or rising churn rate, smoothing would be exactly the tool I'd use.
Let's show an example of where smoothing gets in the way.
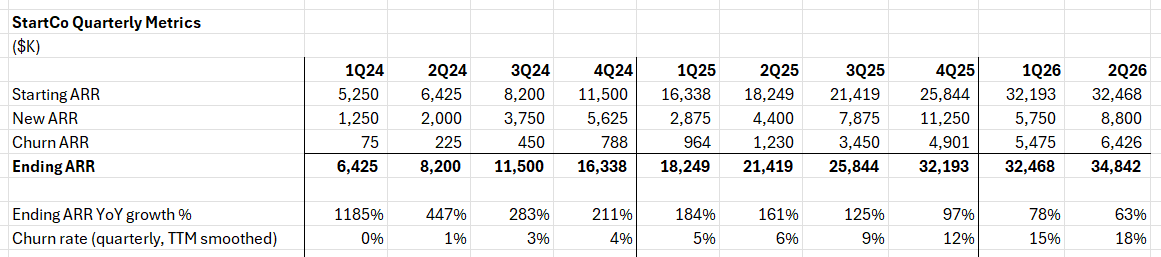
Looking at this chart, here's what you might think:
StartCo is doing pretty well. They ended 2024 with $16.3M in ARR, then nearly doubled that to $32.2M in 2025. Growth's slowing down a bit in the first half of 2026, but that's probably just the law of large numbers.
The churn rate's been increasing, but their first year of operations was 2023, and since they do one-year minimum contracts, there wasn't much that could churn. So the rate seems to be converging in the 15% range, which is pretty normal. (And equivalent to a GDR of 85%.) Gosh, I'd prefer that to be 85% instead of 82%, but otherwise everything's looking pretty good.
You might think that. You'd be missing some signs though:
- Churn ARR dollars are exploding – nearly $5.5M of churn ARR in 1Q26. (Only showing rates tends to hide such things, which is why I show dollars, too.)
- Net new ARR is nearly zero in 1Q26 which I noticed by sliding my eye along the Ending ARR line: from $32.2M in 4Q25 to $32.5M in 1Q26. Whoa! What the heck is going on?
Let's add just four rows to our sheet and see how the picture changes:
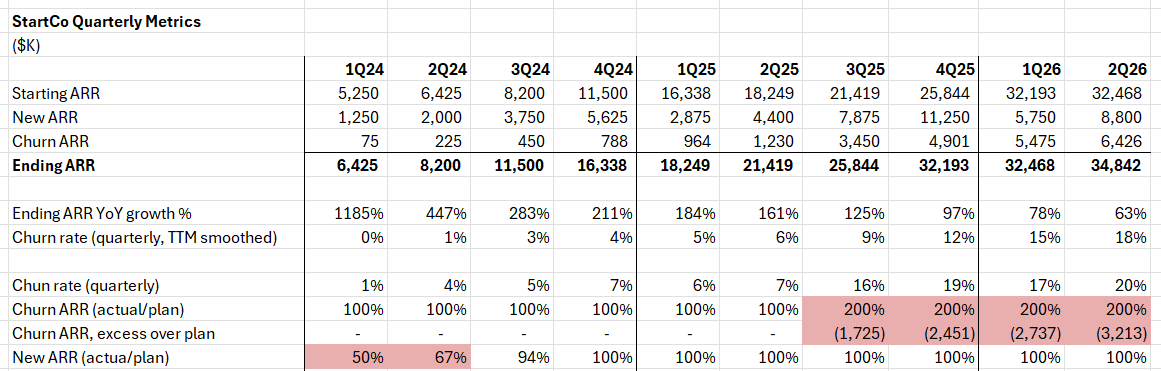
The first row I added was quarterly churn rate, which I'll define here as churn ARR / starting ARR. That's not a great way to calculate it, but it helps me for several reasons.
First, it's a quarterly metric, so it bounces around from quarter to quarter. That volatility is exactly what I want because it lets me see immediately whether we had a good or bad renewal quarter.
Second, while it's not shown in a visible row, I have the churn ARR plan number in the sheet so I can start comparing actual churn ARR to plan. You can see that after six quarters running at 100% of plan, actual churn suddenly jumps to 200% of plan in 3Q25.
But holy cow. It's the 2Q26 board meeting (held in April 2026) before the smoothed churn metric finally gets my attention with an 18% churn rate. The problem actually began in 3Q25. We should have been discussing it at the October 2025 board meeting.
Third, I can show excess churn ARR – the amount by which actual churn exceeds plan. These aren't small numbers: $1.7M, $2.5M, and climbing. Now multiply those numbers by your CAC ratio to estimate what it's going to cost to replace that lost ARR.
And I snuck in one more row to help the Sherlock Holmes types figure out what happened here: New ARR / Plan. What does plan attainment show us? After a good first year in 2023, the company gets off to a terrible start in 1H24. You can't see that by looking only at growth because the company is growing off a tiny base (ending ARR grows spectacularly at 13x and then 6x in 1Q24 and 2Q24).
So we need to look at plan-relative performance instead. The company achieves only 50% and 67% of plan, respectively. Those are the kinds of numbers that get a head of sales fired.
What does our desperate sales leader do? He broadens the ICP, so the team can sell to a much wider range of customers. Because that's the only way he thinks the team can make the numbers. And it works. They hit 94% of plan in 3Q24 and 100% every quarter thereafter. Life is good.
Until 3Q25, that is, when all those formerly non-ICP customers start coming up for renewal. The available-to-renew (ATR) churn rate doubles from 15% to 30%. That's what drives the excess dollar churn and causes Ending ARR growth to flatten.
This example shows why I hate smoothing:
- It delayed the conversation from October until April.
- During that delay the problem kept getting worse. We sold more and more customers who weren't successful with the product – and who perhaps never even had a realistic shot at succeeding. (I once took over a company where the Professional Services team refused to implement certain customers, sending those doomed projects to partners instead. That did wonders for our partner relationships, too.)
Yes, there were other signs, even in the metrics table. Churn ARR dollars were exploding. Inside the company, the Customer Success team should have been screaming. Post-implementation CSAT scores should have been plunging. Solutions Consultants were probably grumbling loudly as well.
But if you were outside the company – sitting on the board – and the first metrics table was all you got, you might have missed it.
You might have asked, "Why do we smooth the churn rate?"
To which management would answer, "To hide the volatility."
To which, I hope you'll always answer: "The volatility is the point."
I'm here for the volatility. If I want to smooth the metrics, I can. But I can never unsmooth them.

The spreadsheet is available here.